Those that watched the market this past week saw some pretty powerful moves, until you look under the hood, as the major indices all had close to double digit gains for the week. The Dow was the laggard of the bunch as it gained 9.7% while the biggest gainer was the S&P which gained 12%. The Nasdaq was right between with an impressive 10.9% gain. However, as I mentioned, under the hood the gains aren’t that impressive. Look at the volume that accompanied the gains and you begin to see that the “full market participation” wasn’t there.
Despite the gains this past week, the major indices still had a losing month for November. There is no question that we are at a bifurcation in the market where we could break higher. However, the technical picture suggests otherwise. Look at the $SPX below and you will see that we are still in a downtrend and we are at the current level of resistance. If we do break higher, it would make sense that we should see huge volume. Why? It’s called a short squeeze or short cover rally or whatever you want to call it when a significant technical level is broken. If we break above that level and there isn’t a surge in volume then we have a bear trap and the market will again fall back under that level. BE CAUTIOUS!
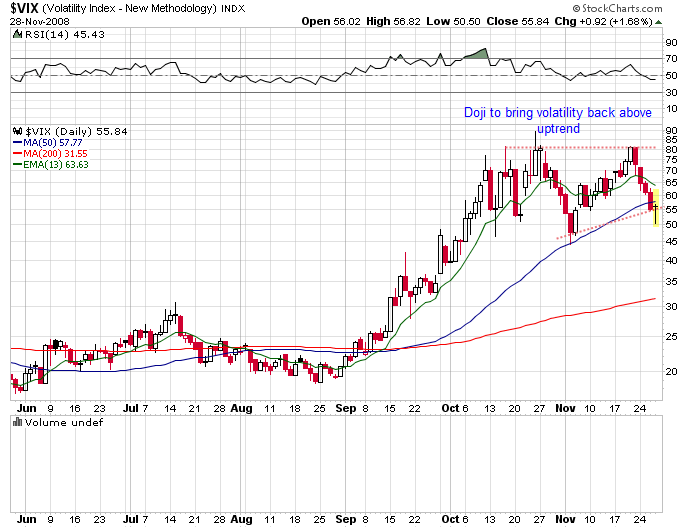
There is the other side of the story and that is that investors are just tired of losing money and buying does ensue and rally. You will still need to see that huge increase in volume and follow-through. One other key indicator would be a significant break lower in the volatility ($VIX) as the direction of the market becomes more clear. Odds are that we will trend between the support/resistance levels for at least the current month. Good strategies for such markets are covered calls, credit spreads, and calendar spreads.
On Monday we start the month of December trading. We also get the ISM index and construction spending. On the earnings front we have no S&P 500 companies reporting.


