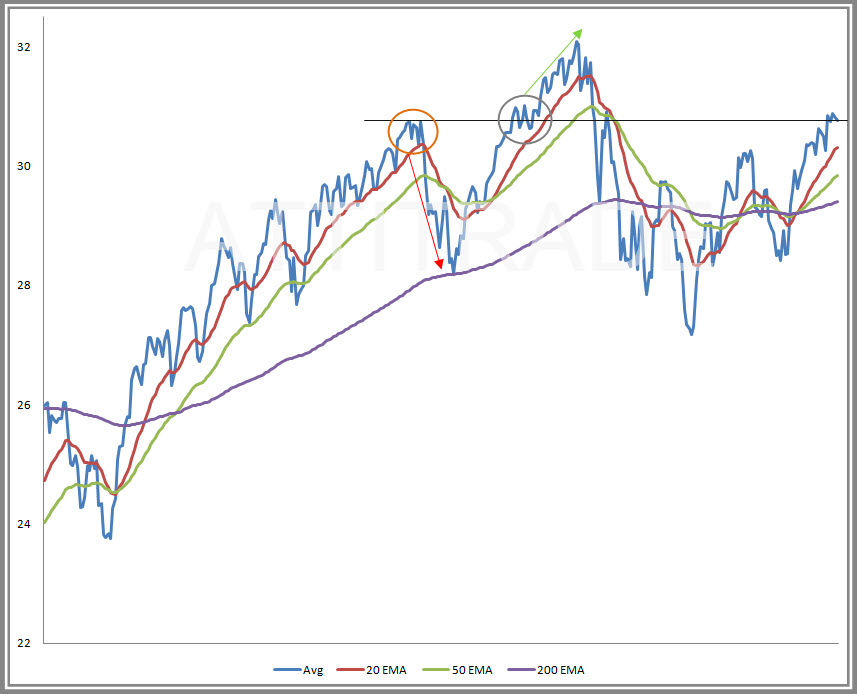
I wanted to share an update to my proprietary indicator which finds itself in a decisive area at the end of the quarter. The black horizontal line is my reference point and both the orange and black circles represent similar action to where we are now. The red line is the 20EMA and you can see how it has acted as support with the indicator in the past. In the area highlighted by the orange circle, when the average was up near current levels, it caved and broke through the moving averages in a hurry only to bounce off the 200 EMA. The black circle shows some sideways chop at the current level, never really touching the 20 EMA, and eventually breaking higher.
I see the indicator as a bit over extended and cautiously looking for a pullback. However, more sideways chop would allow the 20 EMA to “catch up” through time and close above the black horizontal level (as it did in the black circle period). In that case, odds increase the further upside movement is in order. The indicator is still giving a buy signal so I’ll cautiously honor that. The last neutral signal was given back on 9/7 which was preceded by a week of sell signals from 8/27 to 9/3. Bottom line is that I’m not leaning heavy in either direction here but rather watching and participating lightly with plans in place to add to positions once direction becomes clearer.


I think the FED may be doubtful but the market isn’t so with that i’ll use my latest sentiment indicator that for the time being bear hides are SIMPLY out of fashion for fall dahlink