Before reading further please consider my trading style. I sell premium in far out-of-the-money options which allows me to be less specific on technical levels. In other words, I’m not buying a put or a call that can lose value as price moves and time work against me. When you buy options the underlying needs to move far enough in price to offset the Theta erosion that occurs each day. And that doesn’t work in a paused/resting market. There’s also implied volatility to consider, amongst other variables, so the more exact you are in your analysis of where to buy the greater your profits will be as a directional trader. I already know my profit and play the high probability that the options expire worthless.
While I still need to be close in my analysis I can have wider margins of error as to what levels I sell premium against. Time works for me instead of against me, which is nice, as do paused/resting markets. I still have to contend with implied volatility, Gamma and other variables but overall the wider margins of error allow me to be wrong for a period of time. This post isn’t about the many variables that go into options trading so just know that my style doesn’t require as much exactness as a directional trader would.
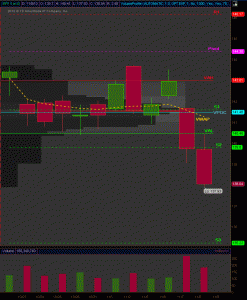
Below are some charts that I looked at after today’s close and thought I’d share them. Keep in mind that option expiration is next Friday (the current put/call ratio for SPY is 1.93) and there’s a lot of call premium that is now out-of-the-money. However, there’s also some good sized put premium that has come into open interest since Tuesday (the max pain is currently at 143).
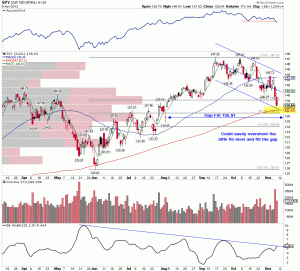
* The 8/2/12 close depends on which chart you look at. Stock charts and prophet charts (in ToS) show the close at 135.91. Free stock charts, Yahoo and ToS charts show the close at 136.64.
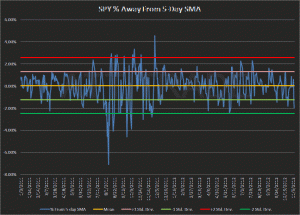
Are we oversold here? Depends on your time frame. Short-term I’d say yes, longer term (beyond 2 days, lol) I’d say not even close. As a premium seller I can go in on a “capitulation” or “fear” day and sell some elevated premium in the puts. The implied volatility ramps up intraday and takes the bid/ask spreads with it. I haven’t seen that the last two days which suggests to me that either everyone is hedged already (doubt it) or there’s more downside to come. If you looked at the % away from the 5DSMA chart for SPY above you noted that we aren’t at -2 standard deviations (last 2 yrs) yet. NYMO closed at -48.95 (half way to -100 which is where I’d consider being “oversold”). One last data point is the year-to-date VWAP currently down at 137.08 which could act as a magnet.
Bottom line is that the potential is there for lower prices just as much as it is there for a bounce. I could easily see a move higher into option expiration as we’re way outside the value area (70% of trading volume) with 6 trading days left. However, take a look at this chart and you can see that May’s cycle was nasty so there comes a point where you can throw the volume profile for opex out the window as the net Delta or some Geo-political issue is in the driver’s seat.


