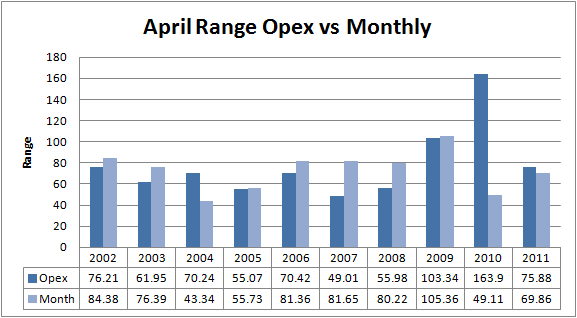
As a premium seller I’ve already been in the month of April for two weeks. One of the data points I track is the range for both the option cycle and the month. On average, over the past 10 years, the range for opex is 78.2 points while the monthly range is 72.74 points. If you look at the chart below you can see that 2010 is an outlier where the option cycle had a massive 164 point range and throws the averages off a bit for opex range. If I take 2010 out the range is 69 which really isn’t that far away from 78, just a few strikes in SPX options.
1404.17 is where we opened on the 1st Monday (3/19) of the April option cycle so over the last decade I can expect, on average, an 80 point range from there. Will it be straight up to 1484? Not likely, but taking a percentage of the range and adding/subtracting it to the open gives me a pretty good idea of what to expect. This helps me manage my risk as well as I can see if these levels match up with any technical levels. I’d expect support/resistance at or near those levels and if that doesn’t occur then I may need to adjust my positions.
For April I can easily see $SPX 1449 (R2 for opex pivots) getting hit before option expiration in three weeks just as easily as I can see 1360 (S1) although 1449 seems more likely. We’re all susceptible to confirmation bias and that’s one of the reasons I check the range each option cycle before I sell a single spread. This is just a small part of my analysis each option cycle but an important one as it keeps me from selling spreads too close.


Would you be willing to share this data for all months?