
There are many indicators that we as market participants can use. So many in fact that some become overwhelmed in their search for the “holy grail” of indicators. What matters most when choosing an indicator is whether or not it improves your trading. Here’s a quick tip. Put an indicator on a price chart of your favorite time frame and look to the left. Does the indicator give you an edge?
One of my favorite categories of indicators assess market breadth. There are many ways to assess market breadth such as advancers-decliners (many derivations exist on this alone like the McClellan or the TRIN), % of stocks above a moving average, new 52wk highs/lows and many more. The key idea is that whatever breadth indicator you use it needs to add value to your trading. That value is that the reading of the indicator helps you in forming an opinion of overall market direction.
One way I look at breadth is using a momentum oscillator of relative strength (RSI). The RSI has a look back period with 14 being the default. A 2-day RSI is one of my favorite indicators but I’m using 14-days for this study to give me a longer look back period. In fact, I’m taking it a step further by using a simple moving average of the 14-day RSI. This really smooths out the signal for longer term setups of a month or more.
Below is a chart showing a 20-day SMA of the 14-day RSI. However, it’s not the traditional RSI but a ratio of the RSI. Let me explain. This ratio is taking the number of SPX components that have an RSI(14) below 30 (oversold) and dividing it by the number of SPX components that have an RSI(14) above 70 (overbought) then smoothing it out over a 20-day period. Why do I use this ratio and periods? Because it lends itself nicely to my main trading strategy of selling option premium on the SPX.
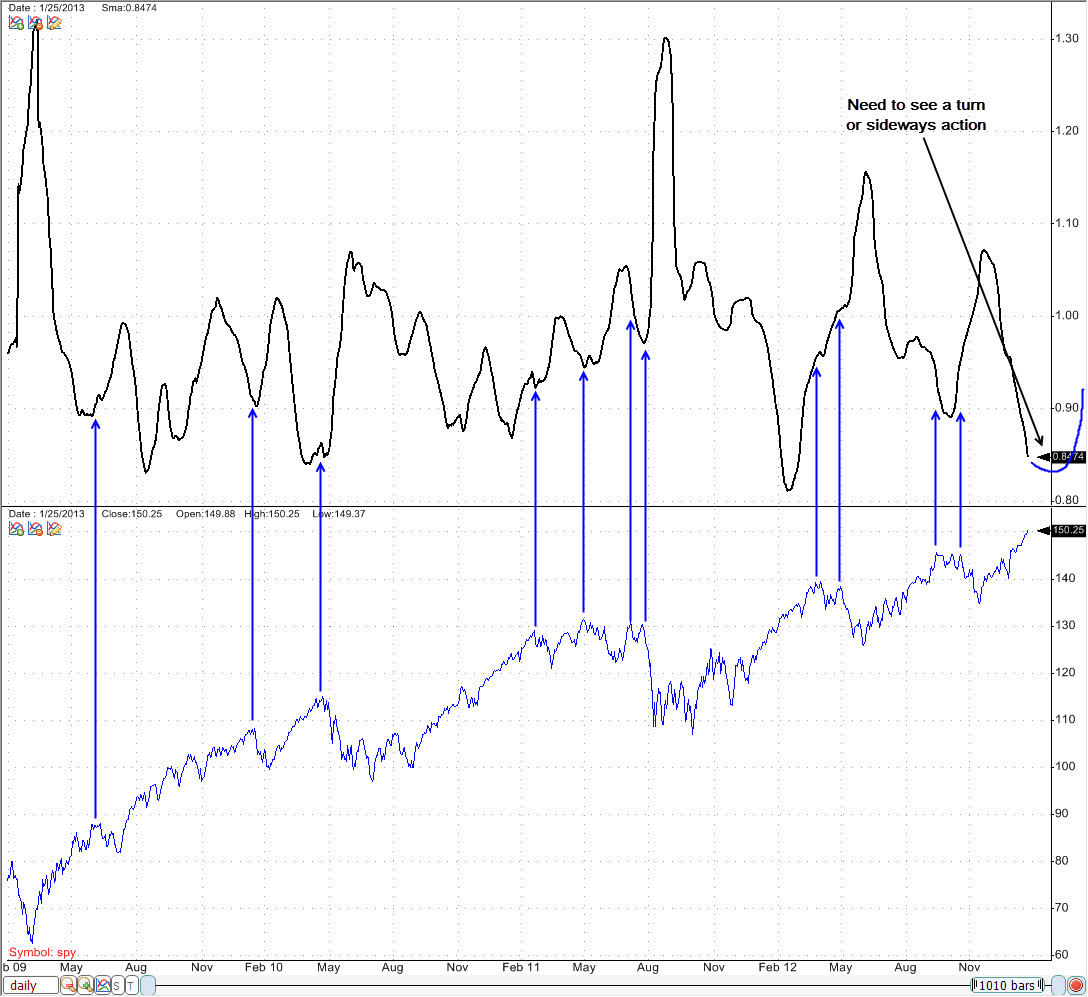
You can see where this ratio turns and where the market tops out or bottoms. It’s not as clear cut as I’d like, which is why it’s one of a few indicators I use, but it gives me a good overall picture of market breadth with a look back period of about 1-month. The current ratio is at its second lowest point in the past few years which suggests a top may be near. This makes sense as other indicators and sentiment suggest the same. However, look to the left and you’ll see that rarely does a turn in this ratio indicate a top/bottom. Rather a process is started once the turn appears. The first indication of a top I’ll be looking for is a turn up in this ratio (I drew a blue line to show what it could look like). In other words, there’s nothing telling me here that a top is in place.
While I’m not one to call tops or bottoms, this ratio helps me define risk in selling premium. With the current state of the ratio I’m more willing to sell call premium than put premium as the potential for a turn or a topping pattern is much higher than higher prices. Does that mean higher prices aren’t likely? NO! What it means is that I can go out to February and sell some call spreads beyond 1550. There is no holy grail to trading. However, there are some great indicators and variations of those indicators that can improve trading. All it takes is some sweat equity and a desire to improve.
There are other ways I use breadth as well. Here’s a look at the % of SPX stocks that closed above their daily pivot, smoothed with a 20SMA. Another way to look at breadth is the up/down volume spread. I’d love to know if you have unique or different ways of either looking at breadth or using breadth in your trading.
Good post. What software do you use to generate your graphs and calc your indicators? Thanks!
Thanks. I use Quantshare.