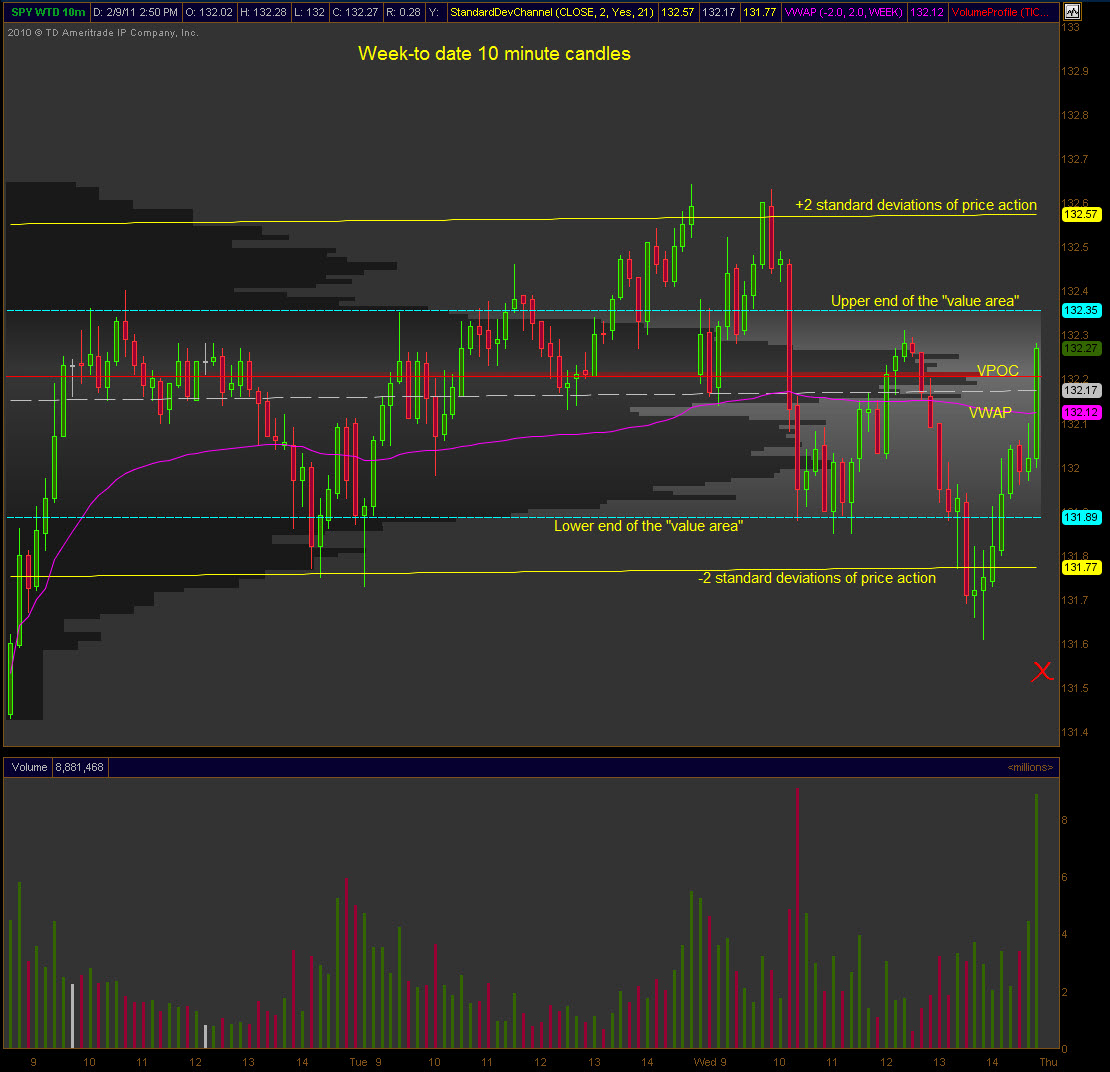
I’ve been asked by many to explain some of my tweets and indicators that I use during the day. Nothing fancy and most are accessible to anyone. I’ll start with a week-to-date chart of the $SPY that I keep up on my middle screen. Actually it only takes up 1/2 the screen as the other side has an intraday chart of the same.
The main thing I watch is the trend as the week progresses and that’s a simple standard deviation channel (yellow lines with white dashed line as center). This dynamic indicator helps me keep perspective on parabolic moves and the likelihood of continuation or reversion.
The value area (blue dashed lines with grey shading) is where 70% of the price action has occurred. I’m looking for shifts in this value area when trading occurs outside the value area. In other words, a change in whether the equity is worth more or less.
The pink line is the volume weighted average price and the red line is the point of control, both are dynamic.
The red X down around 131.55 is where the $SPY is trading in the pre-market. It looks to open outside both the value area and the standard deviation channel. What I’ll be looking for is whether that move is accepted (price will continue to explore lower for a new or previously accepted value) or rejected (price moves higher back to accepted value).
Nothing special or proprietary here and I’ll make a few more posts with other chart setups I use.


How’d you get VWAP in there? I have ToS too and haven’t figured it out. Help desk said it wasn’t possible. I find that hard to believe, though.
It’s a default study of TOS’ http://twitpic.com/3yczzf/full
Thank you. I was looking in “Prophet.” I found it in “Charts.”