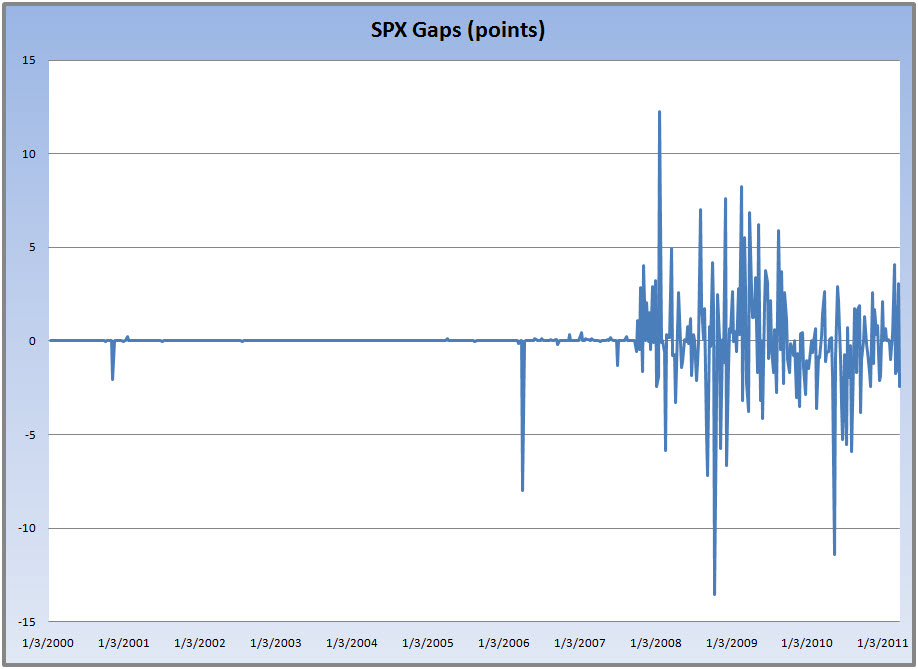
Quick post to share something from research I’m conducting. I’m delving into the weekly options in $SPX and one of the areas I wanted to look at was gaps. Below is a chart that shows the difference between Friday’s close and the following Monday’s open, in points. Decent volatility from the financial crash to today. Pretty amazing when you stop and think about it.
SPX Gaps
This Post Has 2 Comments
Comments are closed.


very interesting chart. looks like most are within 5 pts, but the fact that there used to be barely any and now a ton…global markets more intertwined or so much changes over the weekend?
I’d add anchoring to the financial crisis and the disbelief in the 666 rally.