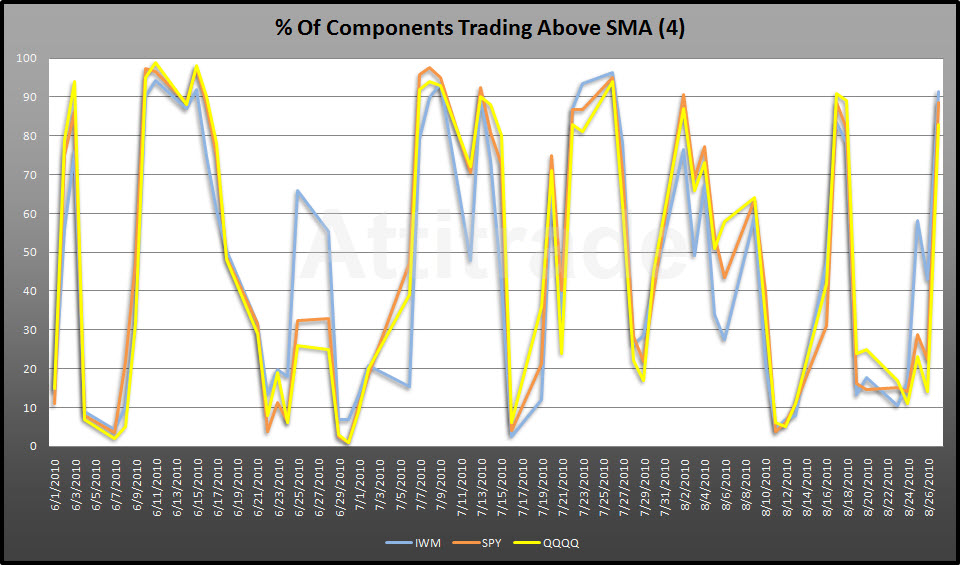
What a difference a week makes. Last Friday (8/20) the $IWM had 18% of its components trading above the 4SMA while the $SPY had 15% and the $QQQQ had 25%. As of the close Friday (8/27) the Russell 200o shows 92%, S&P 500 came in with 88% and the Nasdaq placed with 83% of its components trading above the 4SMA.
If you look at the chart below you can see that since June the air above 90% has been rather thin. I’m not calling a top, but rather something to watch as a tell. Bullish activity would be signaled by an extended stay above the 90% range while bearish activity would show an abrupt drop (like 8/17).

