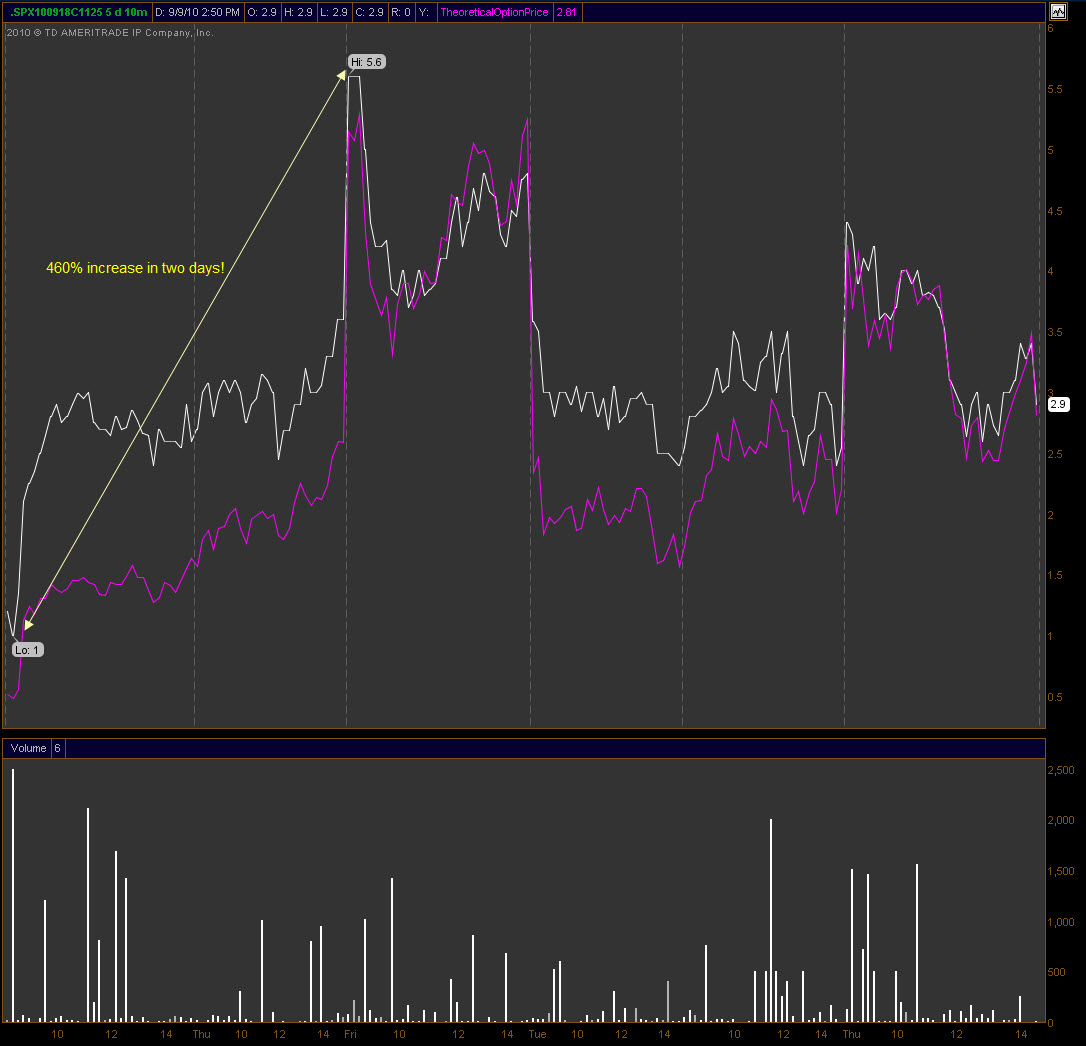
Each option cycle I attempt to pick a leader in the $SPX option chain that can guide me. I typically look for strikes that are close to important technical levels such as prior support or resistance. For September I chose the 1125 calls for my sherpa since it’s near the head of a “head and shoulders” pattern and thus considered important by many.
If you look at the SPX chart below you can see that 9/1 was a significant advance in the broader market. The following two days brought more buying while some expected resistance (like the 50 sma or the near-term highs of 8/18) was nothing more than a brief hesitation on the climb higher. In those three days the SPX put in a nice 5.25% gain.
 Over that same period my sherpa gained 460% as the 1125 calls that were a dollar are now trading at 5.60! The chart below shows the “going rate” for the September 1125 call (white) and the theoretical price (purple). Notice how there was a significant separation from the theoretical and actual pricing on the first two days? That’s the extrinsic value (time and volatility) of those 1125 calls being bid up. When there is such a discrepancy it suggests a strong belief that SPX will make it to 1125 by option expiry as buyers are willing to pay more than the theoretical price of the option.
 Not everyone buying those 1125 calls believes that SPX will make it to that level by expiration and will sell them back the same day or within days. For some it’s simply an option selling at a price that they are comfortable trading while the market moves higher.
Notice that once the short-term top was put in on 9/3 the theoretical and actual prices came together. However, on the 7th and 8th the calls were being bid up again as the separation in the chart would suggest. Today’s (Thursday) price action showed a nice pop at the open, as would be expected, but the theoretical and actual prices are very close together for most of the day. I’d be watching for separation here which would suggest the belief of a move higher is still a valid one.
The erosion of the Theta, one of the components of the extrinsic value, can be seen as the 1125 calls that were trading for 5.60 are now down under 3.00. This loss of conviction is being seen in the chains even though the underlying is making advances. In fact, there is still a 19.85% chance that the 1125 strike will be at-the-money or better by the open next Friday. When looking at the odds of the strike actually being touched between now and the open next Friday, there is a 39.9% chance.
Whether or not the 1125 strike gets hit or not isn’t what I’m watching out for. I’m attempting to gauge the sentiment of others as to whether or not that strike will be hit. When the bell rings each day I have a pretty good idea of sentiment by watching my sherpa and the underlying. Let me know if you have questions.

Where can I chart the theoretical and actual pricing as you’ve presented it?
That chart was created with the Think Or Swim platform. In all honesty, the charting is the only reason I have an account there as their execution has gone down hill over the last year.
I believe you can chart similarly in trademonster and livevol but don’t have accounts with either.