
Q2 is officially over along with QE2 so what’s a market participant to do without the Bernanke put !?! Trade your plan. If you don’t have one then shame on you.
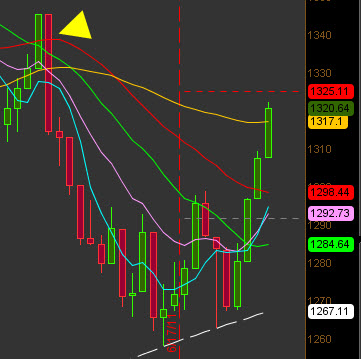
Below is a chart of the $SPX with two points marked where the NYSE 10-day Advance/Decline line went from being very oversold to very overbought (-1250/+1250). Just so happens that after today’s price action we need to add another arrow to the chart by today’s candle. So what happened the last two times this event occurred on (7/19/10 and 9/10/10)? The market continued to make new highs over the next week of 4.08% and 1.45% respectively. In September the market was up over 5% a month later and 10% three months later.

What’s different now? Well, the market is above the 200 SMA, QE2 is done and that’s about it. Bulls have lined their abodes with bear skin rugs since last Summer as many have cried for a pullback of significance. Similar to what I’m seeing/hearing now. Yes, short-term it makes sense to have a pullback here. In fact, it would be healthy to come back down and test the 150-day SMA (1297.89) as support. But the market will do what it wants and I’ll execute my plan accordingly.
Things that I’ve noted recently are:
- 62.4% of the SPX components are trading with an RSI(2) above 90
- 1325.11 is R1 of the July option expiry
- 132.32 is R3 on the weekly woodies pivots
- End of quarter (window dressing)
- Seasonality of the first day of the month is tomorrow (last month was a helluva winner)
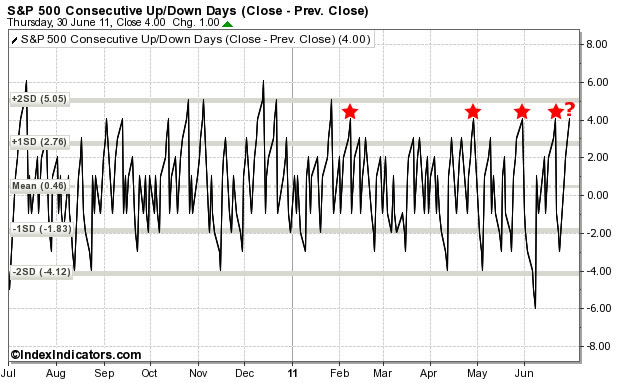
- Market has had issues with 4 day rallies lately [ht:@jackdamn]
There are lots of reasons the market should pull back and perhaps it will. Perhaps it won’t and those that are leaning short will get crushed on the way to 1345. I’m fully invested for the July cycle by now and have my plan set to enact when certain technical levels are taken out. I’ll manage risk when needed as I trade proactively.
I like this. I gave QE2 too much weight. I need to trade what the charts (via price) say.
Quick RSI question. How do you calculate the percentage? Is it based off market cap of the components?
It’s simply the number of components meeting the criteria, greater than 90 here, divided by 500.
This rally was quite rare actually. Only happened 9 times since 1957 where 4 days in a row had returns of greater than 0.85% http://chart.ly/xb3ret5
Rare indeed. Perhaps historical if we close positively today given your chart. Thanks for sharing.