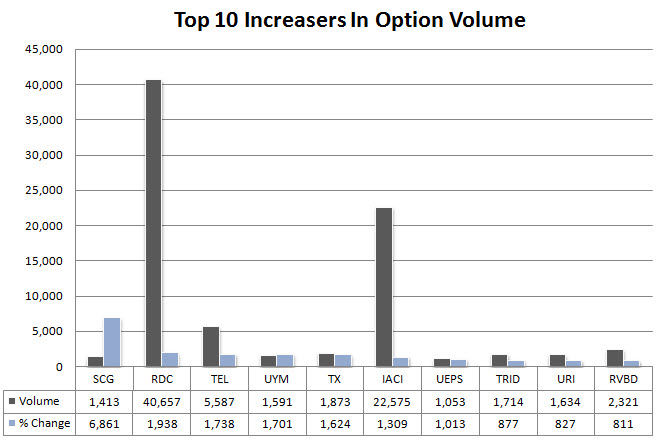
Some selling pressure in the markets today after two days of gains. Keep in mind that we are in a bear market. Look at the option chains for the stocks listed below as their option activity has seen some tremendous increase today. Typically you can see what others are thinking by looking at the option volume and perhaps see some institutional action as well. As an example, $IACI saw an 8,500 strangle between the Jan 2010 $12.50put and the Jan 2010 $22.50 call go out today. Remember, there was a nice sized put spread with IACI yesterday.
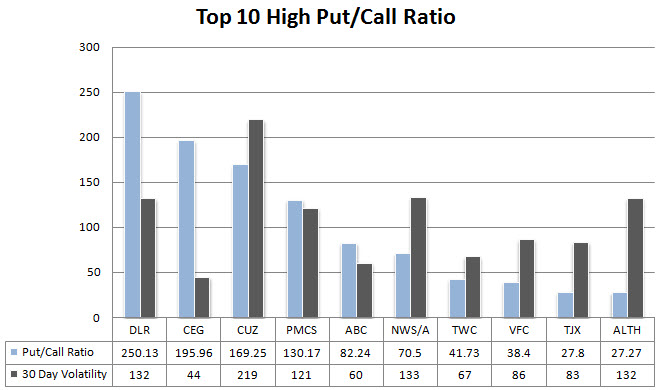
The put/call ratio is a key indicator of sentiment towards a stock with high ratios signaling bearish sentiment. If you look at the charts for these companies and see them approaching resistance then that would make the high put/call ratio logical from a technical perspective. However, if there aren’t any levels of resistance ahead then the chances increase that the high put/call ratio might be fundamental in nature.
The implied volatility (IV) is what the market thinks is going to happen to the historical volatility in the future. For options, when the IV increases, it also increases the price of options due to some news or unseen event on the horizon. Typically, option sellers are more willing to sell options when the IV gets high.


