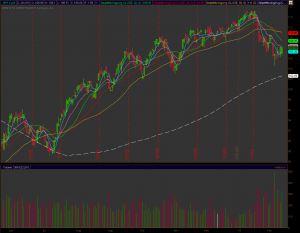
Moving averages are great indicators as they smooth out the sometimes volatile price action. There are numerous variations of moving averages such as simple, exponential, volume weighted, and others. Moving averages are probably one of the widest used and accepted technical indicators out there. What’s interesting is trying to understand why people use the different moving averages and what they’re thinking as price is at/near that particular moving average. Having this information can be invaluable in helping to define parameters of a potential trade. 
Here’s my take on some of the moving averages I monitor. I use these moving averages to help me better understand the thoughts of those that use that particular moving average. I also use some of these for my own trading system, mainly the 5-day SMA, 50-day SMA and the 200-day SMA. Keep in mind I’m using the daily candles and thus the periods would be days.
5-day SMA: Probably the shortest time-frame I use of which I owe the use of it to Brian Shannon. The 5 SMA is basically a week in the market and you’ll tend to see a lot of momentum traders using it as an entry/exit. As an example, I may gete long a name that has either just broken the 5 SMA or is slightly above it and just broke out of resistance. I’ll use the 5 SMA as a stop. Once this period is broken, I’ll more than likely be moving on to the next name.
13-day EMA: considered by me for many years as the swing trader’s moving average. Its measure is close to two weeks in the market and because it’s exponentially weighted the most recent price action takes precedence. This EMA is used for entry/stops so when price action approaches there should be decent support/resistance. I have a scan that looks for stocks that have touched their 13 EMA from above and I run it nightly.
20-day SMA: The short-term trend indicator that is used by swing traders and monitored by most every market participant. At its simplest, this is a monthly moving average for the daily candles. The 20 period is widely used as a signal to enter trades when stocks close above it and exit when stocks close under it. Longer-term traders that don’t mind holding positions for several months use this period. It’s also a widely used moving average for covered calls. (I also us a 20 period sma on an intraday 15-minute candle and love it).
50-day SMA: This is my “line in the sand” as I prefer to own stocks that are above their 50 SMA and be short stocks that are under their 50 SMA. Easier said than done, but the 50-day is a widely used SMA and therefore provides decent support/resistance. I can expect that if a stock approaches the 50 SMA from above that it would find support and bounce. Similarly, if a stock approaches the 50 SMA from below I’d expect it to provide some resistance.
200-day SMA: The institutional moving average and the most widely watched moving average. Institutions are believed to keep an eye on this level and prefer owning stocks that are above the 200 SMA. Not always the case, but the 200 period is definitely a level to provide support/resistance.
The key for me, with regards to these moving averages, is to confirm breeches with volume. As an example, if a stock blows down through the 200-day SMA and the volume was significantly above average then I know odds are good that most everyone sold/exited a long position in that name. Odds also favor that several new short positions were entered as well. What I’d look for next would be a test of that 200 SMA to see if it is newly formed resistance and if it is, then odds increase the stock moves lower. Volume, once again, would be key as the pullback to test should be lighter and then pick up as the low of the day the breech occurred is violated. Seeing such price action would confirm my thesis that odds favor a move lower and I’d look to sell premium at/near that level.
The best thing to do with moving average is to put them on a price chart and then look to the left to see how the stock interacts with it. Perhaps you’ll see that over the past 3 years the 50 SMA has provided excellent support for XYZ and it just so happens that XYZ closed above the 50 SMA after testing it a few days earlier.
