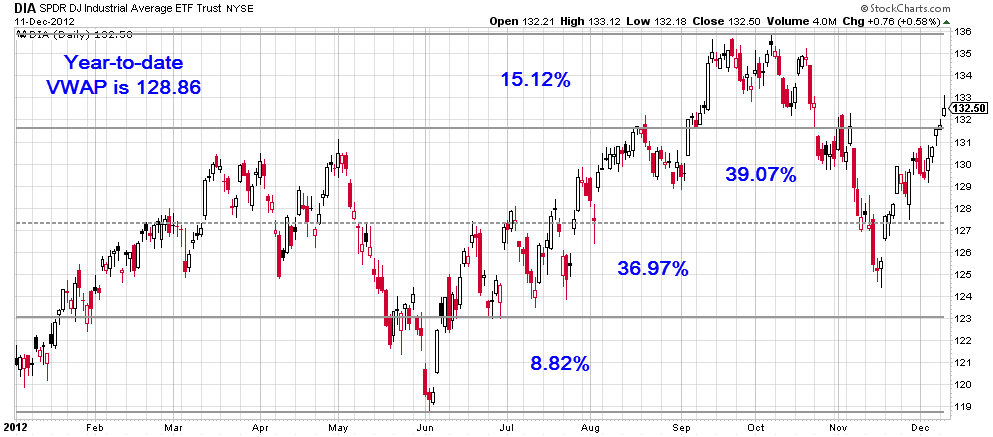
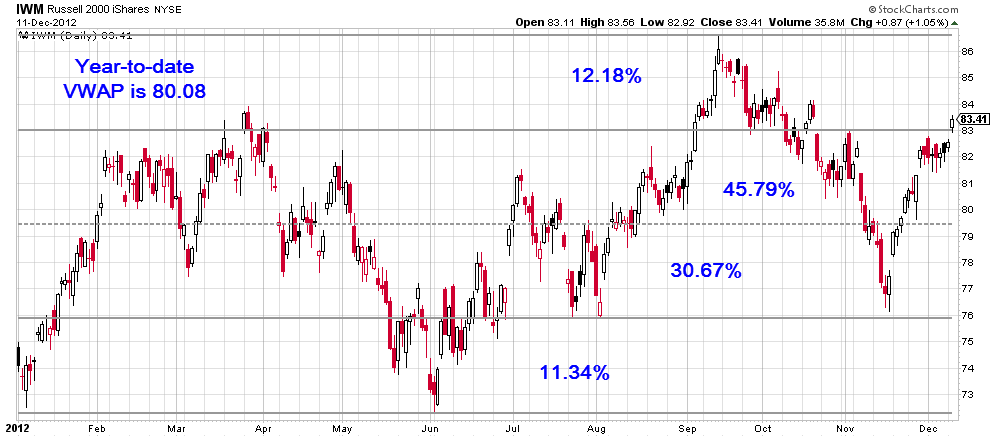
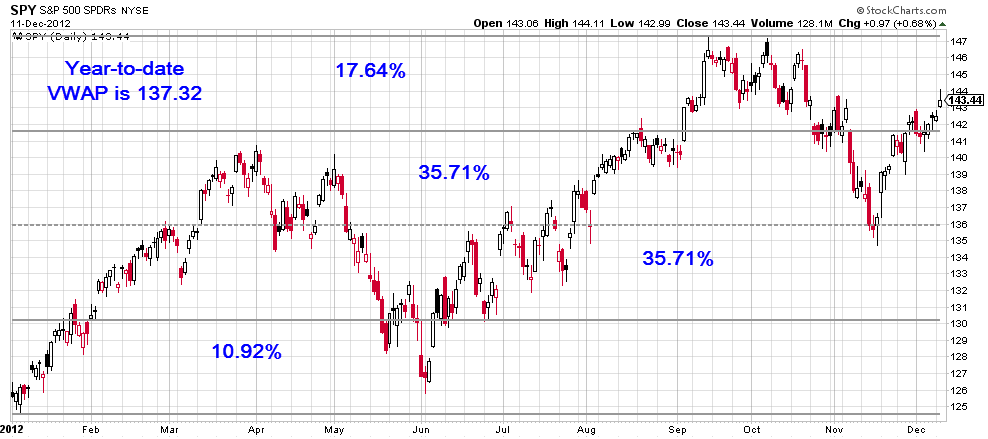
On the 12th day of the 12th month of the 12th year of this century there are 12 trading days left. I thought it would be interesting to see where the ETFs of the major indices are trading. One of the easiest ways to do this is by dividing the price action into quarters from the yearly high to the yearly low. Below are the charts of $SPY $QQQ $IWM and $DIA with the year-to-date VWAP and percentage spent in each quartile. Quartiles are 1-4 with 1 being the bottom most quartile.
A few items I found of interest:
[list type=square_list]- QQQ has spent the most time trading in the upper quadrant of all the index ETFs. However, it is the only index ETF not trading in the upper quartile at this time.
- Every index ETF has spent at least 70% of the time but not more than 77% of the time trading in quadrants 2 & 3.
- Each index ETFs Volume Weighted Average Prices (VWAP) for the year is in the 3rd quadrant.
- QQQ spent the least amount of time in the 1st quadrant. In fact, it never traded in the 1st quadrant after the 1st two weeks of the year
- [/list]
If tech (QQQ) is indeed a leader then it would make sense for price to be in the upper quadrant. From a seasonality standpoint, this week is the weakest of the remaining weeks. December’s expiration (next week) is historically bullish (though the month can be tricky) as are the final few days of trading in the year. As for me and my money, I’m long a 1/2 position in $XIV. I’ve had a good 2012 and I’m not looking to force any trades here.


