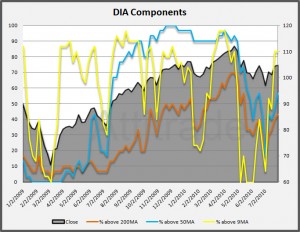
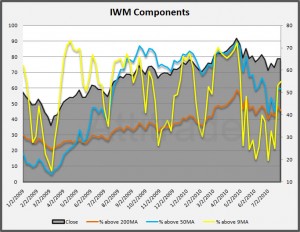
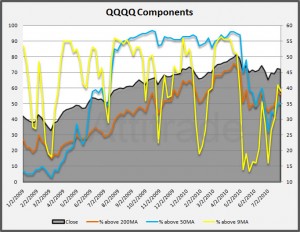
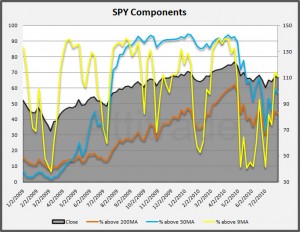
Thanks to your feedback I’ve decided to adjust what I’m posting regarding market breadth. In the graphics below you can see the ETFs I track and how they performed from week-to-week. I’m looking at three time-frames here with a short trend 9 SMA, a medium trend 50 SMA and a longer trend 200 SMA.
These graphs below show the 9sma, 50sma and 200sma as well as the close of the major indices. A healthy market would show the 9sma above the 50sma which is above the 200sma. Let me know if you have questions or suggestions.
Market Breadth Update
Thanks to your feedback I’ve decided to adjust what I’m posting regarding market breadth. In the graphics below you can see the ETFs I track and how they performed from week-to-week. I’m looking at three time-frames here with a short trend 9 SMA, a medium trend 50 SMA and a longer trend 200 SMA.
These graphs below show the 9sma, 50sma and 200sma as well as the close of the major indices. A healthy market would show the 9sma above the 50sma which is above the 200sma. Let me know if you have questions or suggestions.