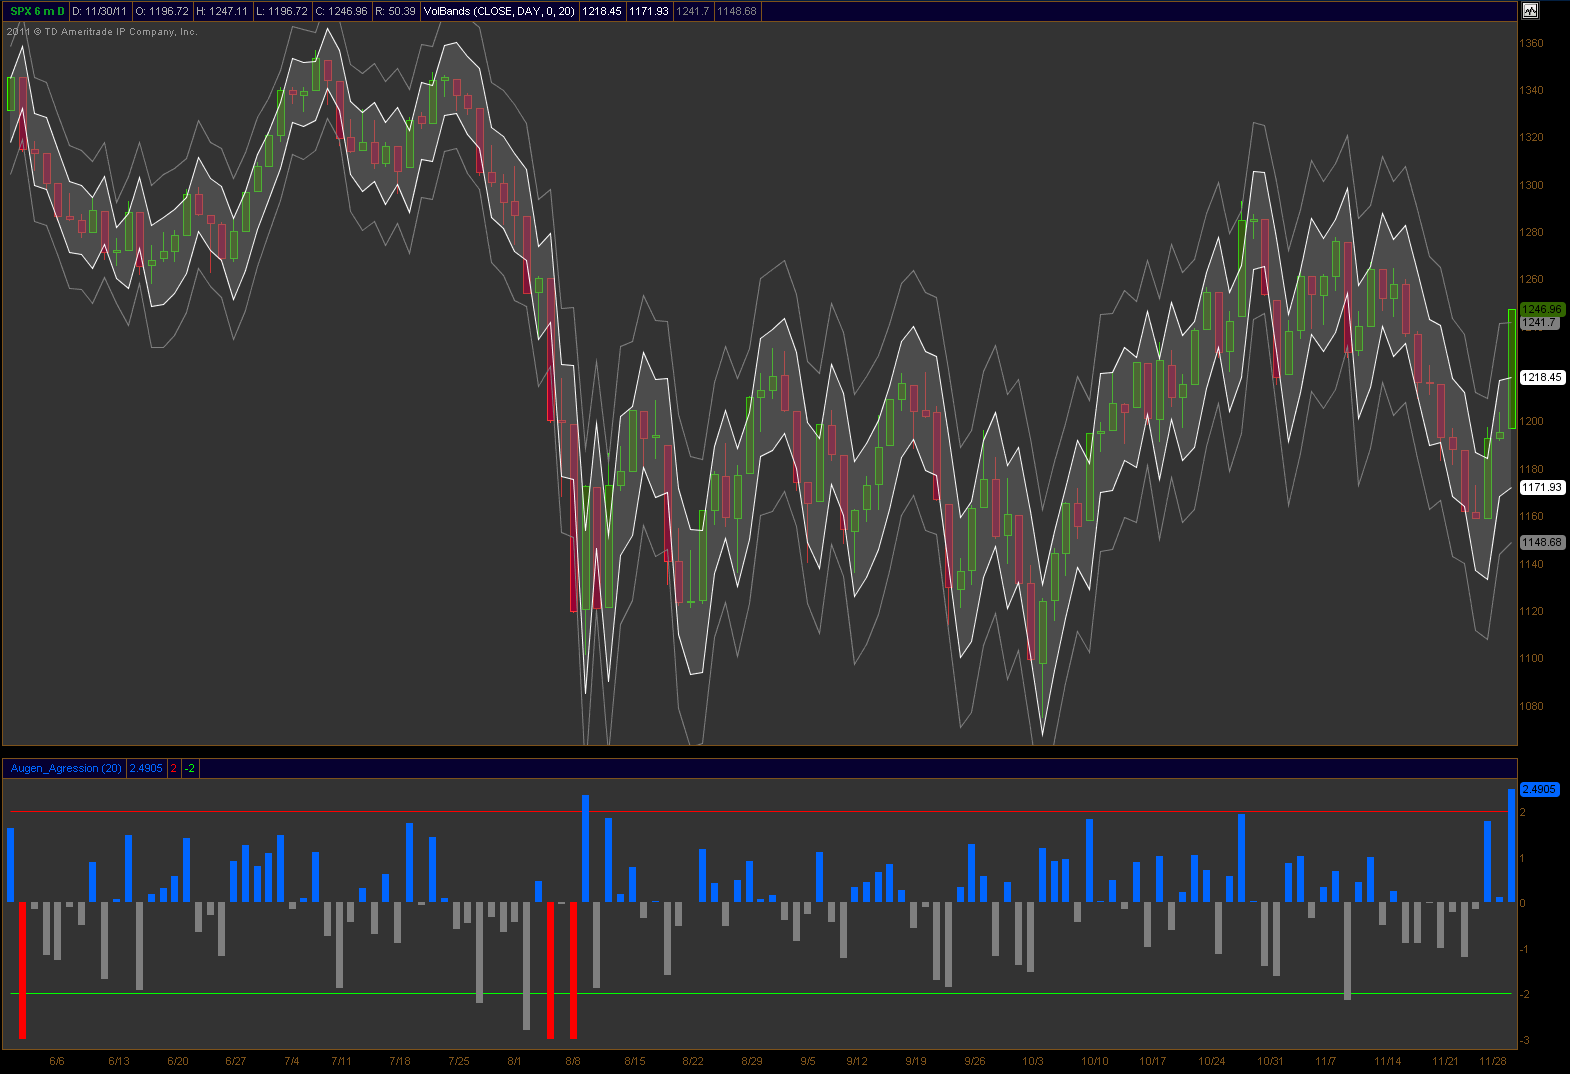
Take a look at the SPX chart below that shows a daily close .42% outside the +2 standard deviation for volatility. Going back 5 years there were five other occasions where SPX closed, on a daily basis, outside the +2 standard deviation. Those dates were 3/23/09, 10/13/08, 9/19/08, 4/1/08 and 3/21/07. Look them up.
As far as the weekly volatility bands go, the +1 standard deviation is sitting at 1269.76 so there’s still room to the upside. Plenty of “reasons” why today was so bullish; the news out of China, The ADP data, front-running the bullish tendency of the 1st trading day of the month, month end window dressing, etc. Take your pick.
Bottom line is that 96% of the SPX components are trading with an RSI(2) greater than 70 while 77% closed above 90. If you’re looking for what to do next, you have poor risk management. Plans need to be in place of where you get out, whether scaling or not and whether wrong or right on direction. I always take some off and protect the rest with stops but stops don’t always work, especially in a market that can gap 3% overnight. Collars work well as do inexpensive calls in $VXX.


Nice post!
Isn’t it kinda ironic that all those dates are from bear markets? funny how biggest up days come in bear markets.