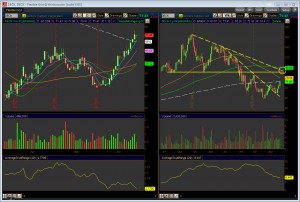
I really like this chart and found it on the moneyflow above 80 scan in the stock scans. You can see that on the daily chart the stock just crossed above the 200 SMA (white dashed line) and did so as the volume increased. Those two things together, along with the moneyflow, tell me that it is a valid break of the moving average. If you look at the chart on the right-hand side you’ll notice it’s of weekly candles. I’ve also put some trendlines and a price level which make a nice convergence right around $90. Notice how the stock is about to break above the white-dashed line, which is the 208 day SMA.
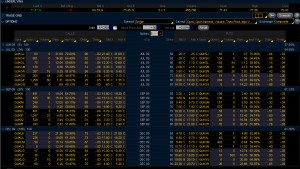
The volume is a little on the thin side as I typically like stocks with an average of at least 500K per day (90 day average) and this one barely makes the cut. In looking at the options, you can see that in both July and September the calls at $80 are where the most open interest (OI) is. That is in no way a target or what strike is a lock, but rather a simple fact. I like the chart and will more than likely set up a defined risk trade using options, perhaps a bull put spread or a bull call spread.


