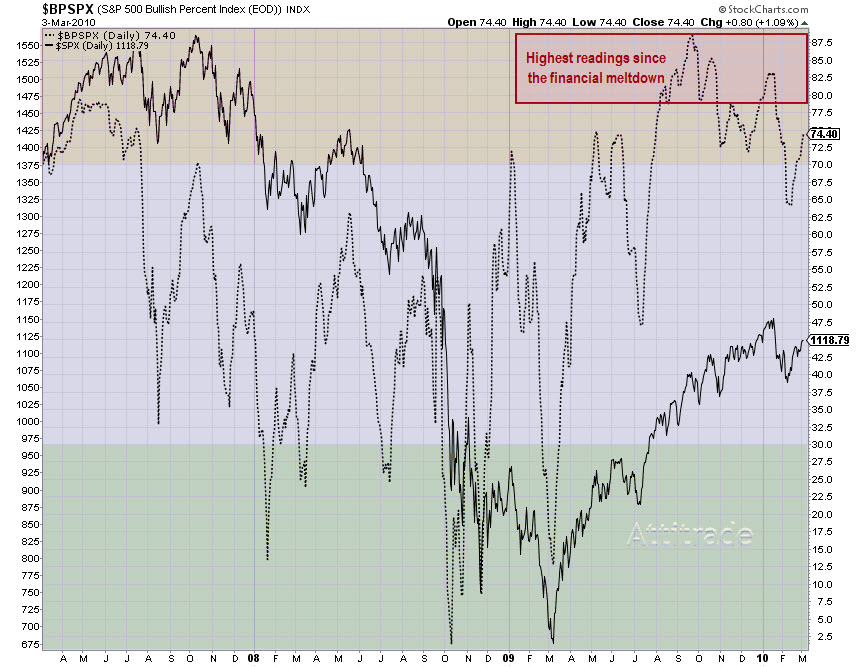
The Bullish Percent Index (BPI) is a unique way to measure market breadth. The BPI is calculated by dividing the number of stocks in a given group (S&P 500 for this example) that have given a buy signal via Point and Figure charts, by the total number of stocks in that group.  The group is overbought when the BPI is above 70% and oversold when below 30%.
What I found interesting was that the BPI is giving overbought signals at levels that haven’t been seen since the summer of 2007. I’m not suggesting that the S&P will drop like it did back then, because we are not experiencing the same catalysts as back then. What this data does tell me is that this rally off the March lows, which has been suspect since day one by so many, is truly impressive.
I’d never take a trade based off of this indicator by itself, or any indicator by itself for that matter, but the parameters for buy/sell signals are as follows. Buy signals occur when the BPI falls below 30% and then reverses up by at least 6%. Sell signals occur when BPI rises above 70% and then reverses down by at least 6%.
