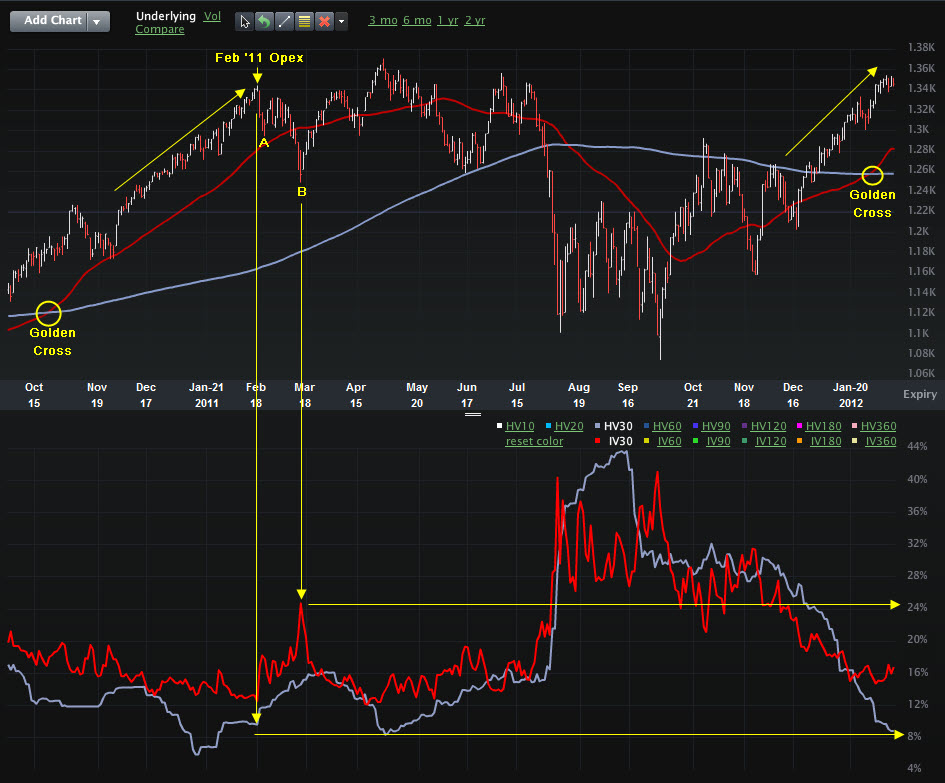
I promised myself that I wasn’t going to post anything until my book is done…just another failed New Years resolution I guess. If you look at the chart below you can see that I’ve marked up a few points of interest. The short-term top (1343) for the ramp into 2011 came on February’s option expiration Friday. This was rudely followed by a 2% pullback to 1315 the following Monday (A). After finding support at the 50-day SMA a few days later the market failed to make a higher high and proceeded lower until finding support at 1256 (B). The damage was a 6.5% pullback from peak-to-trough which brought about some healthy gains after that into April and May. Would make a viable scenario for 2012, no?
You’ll also notice what historical and implied volatility were telling the market as well. Insurance is cheap. It’s against the law to drive without auto insurance and most intelligent people I know have homeowners as well as life insurance. Why, especially after this ramp into 2012, wouldn’t you have portfolio insurance? I’m not a bear nor a bull but make my living selling both sides of the market. In the way of disclaimers I’m currently short (5% of my normal sized position) some February call spreads that expire at Friday’s SET price.

