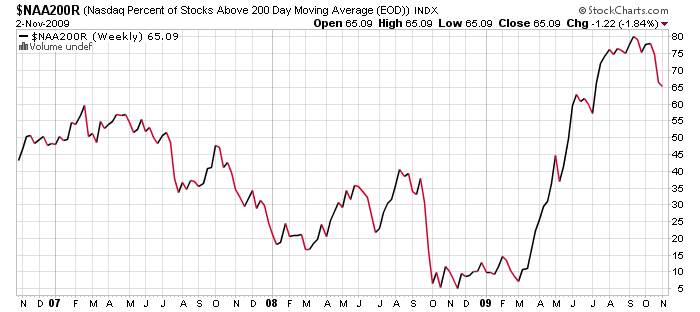
The Nasdaq, Naz, tech, the Q’s, whatever you want to call it has been the leader off the March lows and has also been leading this move lower. It was the first of the major indices to gain a footing above it’s 50-day moving average and was above its 200 DMA a full month before the others. As a result, I feel it is important to watch as a tell of sorts for strength/weakness. Take a look at the chart below which shows the percentage of stocks in the Nasdaq that are above their 200 DMA and you begin to see two things–the bounce has been more like a vertical leap and there is definitely a pullback in progress.
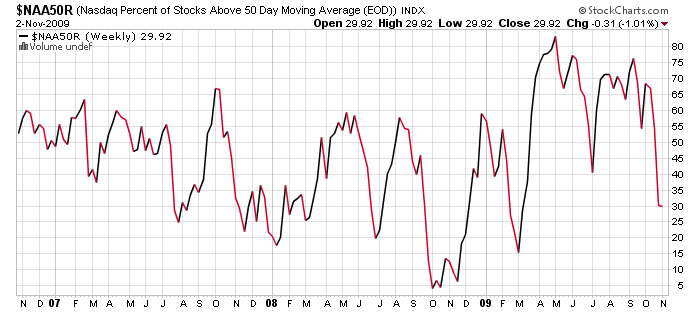
The percentage of stocks above their 50DMA doesn’t show the same pronounced leap as the 200DMA, but it does show the weakness in the shorter term. In fact, we are only 15% off the March lows with respect to this important and much watched moving average.
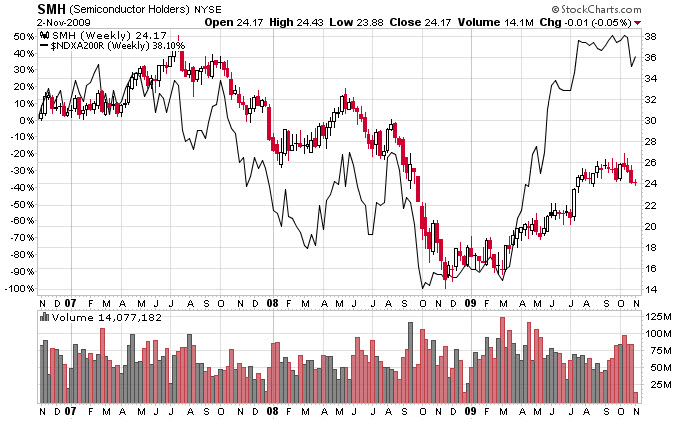
Whenever I think of tech I refer to the semiconductors ETF the $SMH as it is made up of companies that I refer to as “ingredients” companies. In other words, if these companies are not doing well then other companies that rely upon their products will suffer. One caveat though is that over 60% of the holdings for $SMH are in three companies–$INTC, $TXN, and $AMAT. Take a look at this chart that shows the $SMH with the percentage of Nasdaq stocks above the 200DMA and you can really begin to see the disconnect since March.
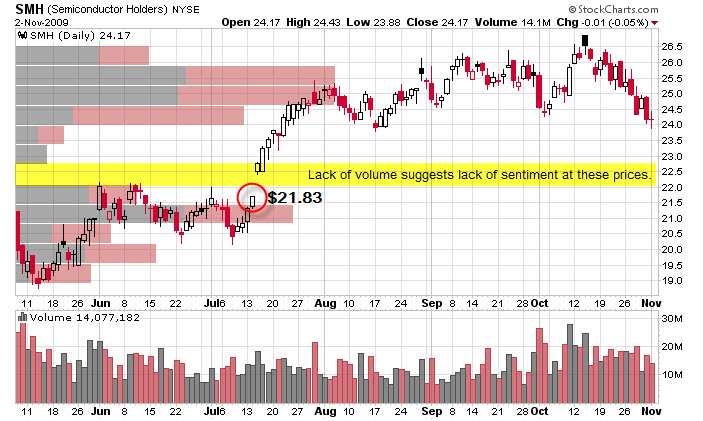
The last chart shows the daily chart of the $SMH and I can’t help but notice a nice gap that looks to be waiting for a fill down at $21.83. I’m not a bear or a bull, but one who looks for levels of support/resistance and sell option premium at those levels. I’m also a technician since I entered this business several years ago and this gap looks like low hanging fruit.


